For Project
1, I am going to analyse the Weather History dataset of a country named
Finland, It Lies At The Northern Europe. The dataset has hourly temperature recorded
for last 10 years starting from 2006–04–01 00:00:00.000 +0200 to 2016–09–09
23:00:00.000 +0200.The
Dataset has been taken from the popular Open Source Public repository named Kaggle.The
URL is https://www.kaggle.com/muthuj7/weather-dataset.Language used is Python
3,the IDE is Jupyter Notebook and
utilized python Libraries for the
project are Numpy, Pandas, Matplotlib. The Null Hypothesis Ho says “The Apparent
temperature and Humidity compared monthly across 10 years of the data indicate
an increase due to Global warming.” Here is this blog post are the steps taken
to draw a conclusion about the hypothesis.
STEP 1: Importing the
necessary libraries
Step 2: Loading the “CSV” file of Weather History dataset
Step 4: Data Preprocessing
------Deleting the unwanted rows & columns
------Resampling the
data from hourly to monthly
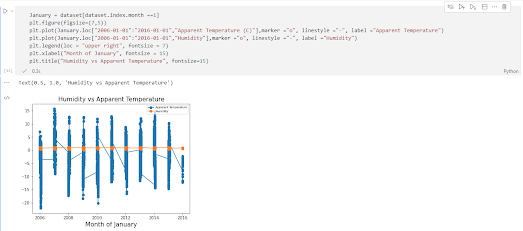
Step 5: Data Visualisation using Matplotlib between Apparent Temperature & Humidity of the last 10 years
Step 6: Monthly Analysis for all the 12 months over the 10 year period taking variation in Apparent Temperature & Humidity.
Conclusion : Except for January,February,March,April,May,October,November and Decmber, there is apparently no relationship between Temperature and Humidity. As we can see from the graph that the lowest temperature was recorded -3 °C Around May 2008 and Highest was 39 °C At Around 2014. But the Humidity remains same with the average of 0.1
We can say that
Due to Global Warming, the temperature has been gradually increased in the
country, Finland over the past 10 years but there is no any affect on Humidity,
it remained constant throughout the years
Link to the jupyter notebook python code script https://github.com/onajite1/Performing-Analysis-Of-Meteorological-Data


Comments
Post a Comment